React에서 차트를 그리기 위해서 Recharts라는 패키지를 사용한다.
검색해보면 다양한 차트 그리기 패키지가 있는데 그중 Recharts가 사용하기 난이도도 적당하고, UI가 마음에 들어서 사용해보기로 정했다.
recharts/recharts
Redefined chart library built with React and D3. Contribute to recharts/recharts development by creating an account on GitHub.
github.com
Installation
우선 React App Project로 가서 recharts 패키지를 설치한다.
npm install recharts
How To Use
★ 프로젝트 구조
src
component
Chart.js
App.js
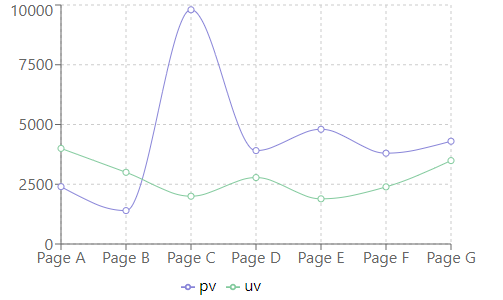
LineChart
Chart.js
import React, { PureComponent } from 'react';
import {
LineChart, Line, XAxis, YAxis, CartesianGrid, Tooltip, Legend,
} from 'recharts';
const data = [
{
name: 'Page A', uv: 4000, pv: 2400, amt: 2400,
},
{
name: 'Page B', uv: 3000, pv: 1398, amt: 2210,
},
{
name: 'Page C', uv: 2000, pv: 9800, amt: 2290,
},
{
name: 'Page D', uv: 2780, pv: 3908, amt: 2000,
},
{
name: 'Page E', uv: 1890, pv: 4800, amt: 2181,
},
{
name: 'Page F', uv: 2390, pv: 3800, amt: 2500,
},
{
name: 'Page G', uv: 3490, pv: 4300, amt: 2100,
},
];
export default class Chart extends PureComponent {
render() {
return (
<LineChart
width={500}
height={300}
data={data}
margin={{
top: 5, right: 30, left: 20, bottom: 5,
}}
>
<CartesianGrid strokeDasharray="3 3" />
<XAxis dataKey="name" />
<YAxis />
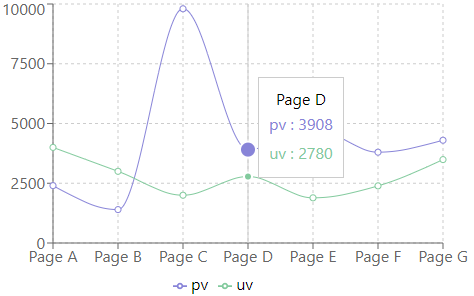
<Tooltip />
<Legend />
<Line type="monotone" dataKey="pv" stroke="#8884d8" activeDot={{ r: 8 }} />
<Line type="monotone" dataKey="uv" stroke="#82ca9d" />
</LineChart>
);
}
}LineChart : 선 그래프
- width, height : 그래프의 넓이 및 높이
- data : 그래프에 나타낼 데이터
- margin : 그래프의 margin
CartesianGrid : 그래프 보조선
- strokeDasharray : 링크 참고
XAxis : X축
- dataKey : 표시할 value의 data map key
YAxis : Y축
- dataKey : 표시할 value의 data map key
Legend : 선의 설명을 나타내는 지표
Line : 선
- type : 'basis' | 'basisClosed' | 'basisOpen' | 'linear' | 'linearClosed' | 'natural' | 'monotoneX' | 'monotoneY' | 'monotone' | 'step' | 'stepBefore' | 'stepAfter' | Function... DEFAULT: 'linear'
- dataKey : 표시할 value의 data map key
- stroke : 선의 색상
- activeDot : 그래프에 마우스를 올릴 시 원의 스타일 설정
App.js
import 'react-date-range/dist/styles.css'; // main style file
import 'react-date-range/dist/theme/default.css'; // theme css file

import './App.css';
import Chart from './component/Chart.js'

function App() {
  return (
    <div className="App">
      <Chart/>
    </div>
  );
}

export default App;
RedarChart
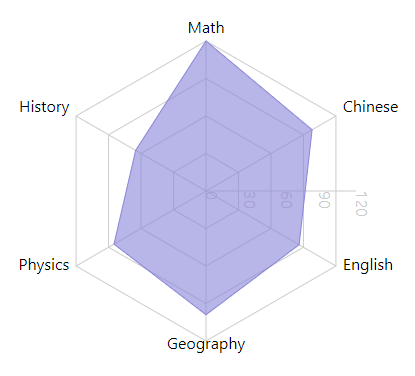
Chart.js
import React, { PureComponent } from 'react';
import {
  Radar, RadarChart, PolarGrid, PolarAngleAxis, PolarRadiusAxis,
} from 'recharts';

const data = [
  {
    subject: 'Math', A: 120, B: 110, fullMark: 150,
  },
  {
    subject: 'Chinese', A: 98, B: 130, fullMark: 150,
  },
  {
    subject: 'English', A: 86, B: 130, fullMark: 150,
  },
  {
    subject: 'Geography', A: 99, B: 100, fullMark: 150,
  },
  {
    subject: 'Physics', A: 85, B: 90, fullMark: 150,
  },
  {
    subject: 'History', A: 65, B: 85, fullMark: 150,
  },
];

export default class Example extends PureComponent {

  render() {
    return (
      <RadarChart cx={300} cy={250} outerRadius={150} width={500} height={500} data={data}>
        <PolarGrid />
        <PolarAngleAxis dataKey="subject" />
        <PolarRadiusAxis />
        <Radar name="Mike" dataKey="A" stroke="#8884d8" fill="#8884d8" fillOpacity={0.6} />
      </RadarChart>
    );
  }
}
RedarChart : 레이다 그래프
- cx : 중심의 x좌표, 백분율을 설정하면 너비의 백분율을 곱해 최종 값 리턴
- cy : 중심의 y좌표, 백분율을 설정하면 높이의 백분율을 곱해 최종 값 리턴
- outerRadius : 마지막 원 그리드의 외부 반지름
백분율을 설정하면 너비, 높이, cx, cy로 계산되는 maxRadius의 백분율을 곱하여 최종 값 리턴
- width, height : 그래프의 넓이 및 높이
- data : 그래프에 나타낼 데이터
PolarGrid : 그래프 보조선
PolarAngleAxis : 데이터 라벨
- dataKey : 표시할 value의 data map key
PolarRadiusAxis : 그래프 보조선의 값 표시
Redar : 레이다
- name : 레이다 이름
- dataKey : 표시할 value의 data map key
- stroke : 선의 색상
- fill : 채우기 색상
- fillOpacity : 채우기 투명도
App.js
import 'react-date-range/dist/styles.css'; // main style file
import 'react-date-range/dist/theme/default.css'; // theme css file

import './App.css';
import Chart from './component/Chart.js'

function App() {
  return (
    <div className="App">
      <Chart/>
    </div>
  );
}

export default App;
참고자료 : recharts.org/en-US/
'FrontEnd > React.js' 카테고리의 다른 글
| [React.js] React Component 생명주기 1 - Mounting (0) | 2021.02.02 |
|---|---|
| [React.js] Leaflet으로 지도 그리기 (0) | 2021.01.10 |
| [React]달력을 이용해 날짜 범위 정보얻기2 (react-date-range) (0) | 2020.11.25 |
| [React]달력을 이용해 날짜 범위 정보얻기1 (react-date-range) (0) | 2020.11.24 |
| [React] React 프로젝트 GitHub Pages로 배포하기 (2) | 2020.11.19 |


댓글